Findings on methane emissions from a range of oil and gas facilities
Since 2017, OGCI has been supporting a series of independent scientific studies that measure methane emissions from different types of oil and gas facilities around the world. The data collected is intended to help companies and governments prioritize actions and policies to reduce methane emissions.
The International Methane Studies were conceptualized in the framework of the COP21 meeting in Paris in 2015. They bring together the efforts of OGCI, the Environmental Defense Fund (EDF), the Climate and Clean Air Coalition (CCAC) and the European Commission (EC) under the secretariat of United Nations Environment to produce independent scientific data on the methane emissions of the oil and gas sector.
Until this programme was launched, most independent research on methane emissions from oil and gas had focused on US onshore facilities. Their findings showed wide variances across operations, with a few large emitters pushing up overall levels higher than expected – but it was not clear whether these findings could be extrapolated more generally.
Read about the Oil and Gas Methane Science Studies on the CCAC website
The Oil and Gas Methane Science Studies use multiple methodologies – measuring on the ground, by air and by sea. They collect data on different types of infrastructure to make a robust quantification of global oil and gas methane emissions. The research is intended to fill knowledge gaps and help companies across the oil and gas value chain to reduce emissions in a more targeted way.
The research is conducted by separate independent teams of scientists, coordinated by Steve Hamburg, the Chief Scientist of EDF. Following peer review, the papers are now being published in a variety of scientific journals.
A dozen scientific studies have been funded so far under the CCAC Methane Studies programme to measure methane emissions in oil and gas supply chains. These cover the Gulf of Mexico, North Sea, midstream/downstream, global LNG, Australia, Norway and Africa.
To date, seven peer-reviewed papers have been published.
Gulf Of Mexico
Methane Emissions from Offshore Oil and Gas Platforms in the Gulf of Mexico
Tara I. Yacovitch, Conner Daube, and Scott C. Herndon
Environmental Science & Technology 2020 54 (6), 3530-3538 (February 2020)
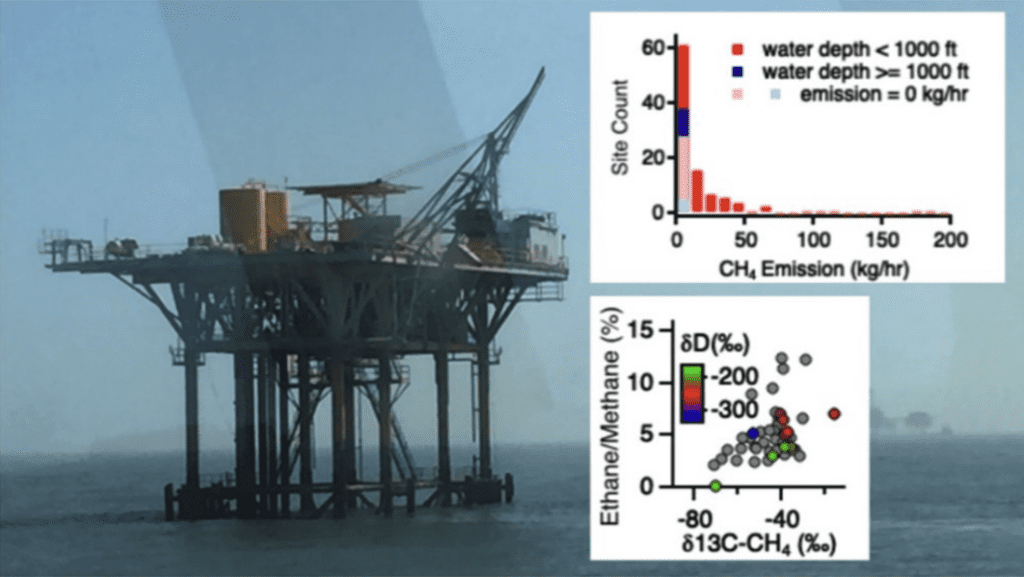
Ship-based measurements of methane emissions from 103 offshore platforms in the Gulf of Mexico found that just two sites were responsible for 20% of emissions, and that deepwater facilities had more moderate emissions rates compared to shallow-water sites.
Abstract
Shipboard measurements of offshore oil and gas facilities were conducted in the Gulf of Mexico in February 2018. Species measured at 1 s include methane, ethane, carbon-13 (13C) and deuterium (D) isotopes of methane, and several combustion tracers. Significant variability in the emission composition is observed between individual sites, with typical ethane/methane ratios around 5.3% and 13C and D methane isotopic compositions around −40 and −240‰, respectively. Offshore plumes were spatially narrower than expectations of the plume width based on terrestrial atmospheric stability classes; a modified Gaussian dispersion methodology using empirically measured horizontal plume widths was used to estimate the emission rates. A total of 103 sites were studied, including shallow and deepwater offshore platforms and drillships. Methane emission rates range from 0 to 190 kg/h with 95% confidence limits estimated at a factor of 10. The observed distribution is skewed with the top two emitters accounting for 20% of the total methane emissions of all sampled sites. Despite the greater throughput of the deepwater facilities, they had moderate emission rates compared to shallow-water sites. Analysis of background ethane enhancements also suggests a source region in shallow waters. A complete 1 s measurement database is published for use in future studies of offshore dispersion.
Gulf Of Mexico
Airborne Assessment of Methane Emissions from Offshore Platforms in the U.S. Gulf of Mexico
Alan M. Gorchov Negron, Eric A. Kort, Stephen A. Conley and Mackenzie L. Smith
Environmental Science & Technology 2020 54, 8, 5112-5120 (April 2020)
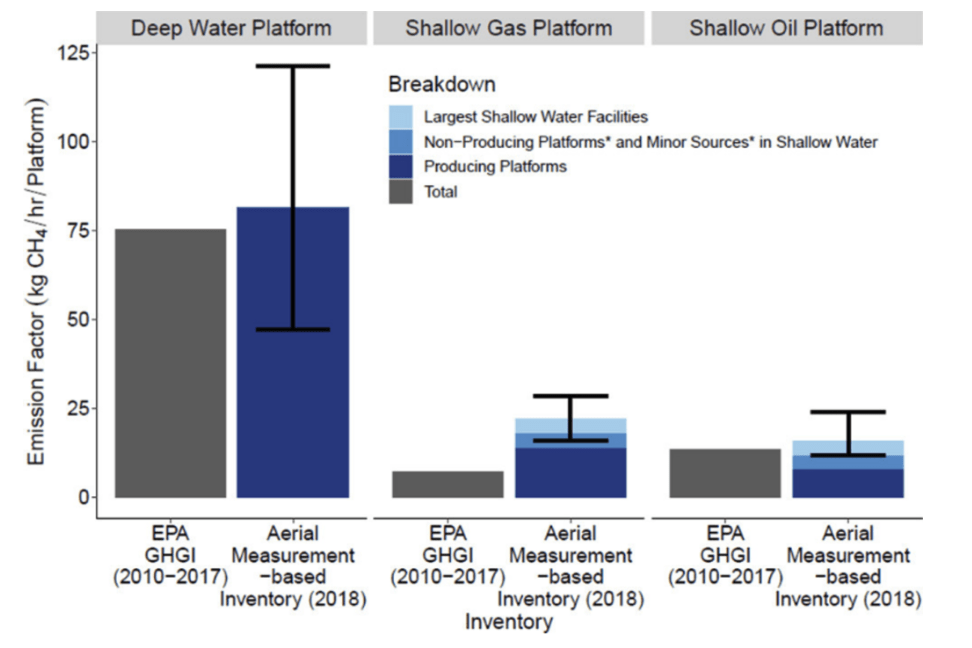
Airborne measurements of methane emissions from oil and gas platforms in the US Gulf of Mexico also show higher than expected emissions from shallow water facilities. The authors see three factors behind that finding: inaccurate inventories of platforms, incorrect emission factors and a small number of very high emission sources. These superemitters were large shallow water facilities, using older multiplatform technology.
Abstract
Methane (CH4) emissions from oil and gas activities are large and poorly quantified, with onshore studies showing systematic inventory underestimates. We present aircraft measurements of CH4 emissions from offshore oil and gas platforms collected over the U.S. Gulf of Mexico in January 2018. Flights sampled individual facilities as well as regions of 5–70 facilities. We combine facility-level samples, production data, and inventory estimates to generate an aerial measurement-based inventory of CH4 emissions for the U.S. Gulf of Mexico. We compare our inventory and the Environmental Protection Agency Greenhouse Gas Inventory (GHGI) with regional airborne estimates. The new inventory and regional airborne estimates are consistent with the GHGI in deep water but appear higher for shallow water. For the full U.S. Gulf of Mexico our inventory estimates total emissions of 0.53 Tg CH4/yr [0.40–0.71 Tg CH4/yr, 95% CI] and corresponds to a loss rate of 2.9% [2.2–3.8%] of natural gas production. Our estimate is a factor of 2 higher than the GHGI updated with 2018 platform counts. We attribute this disagreement to incomplete platform counts and emission factors that both underestimate emissions for shallow water platforms and do not account for disproportionately high emissions from large shallow water facilities.
Midstream / Downstream
Mapping Urban Methane Sources in Paris, France
Sara M. Defratyka, Jean-Daniel Paris, Camille Yver-Kwok, Julianne M. Fernandez, Piotr Korben, and Philippe Bousquet
Environmental Science & Technology 2021 55, 13, 8583-8591 (June 2021)
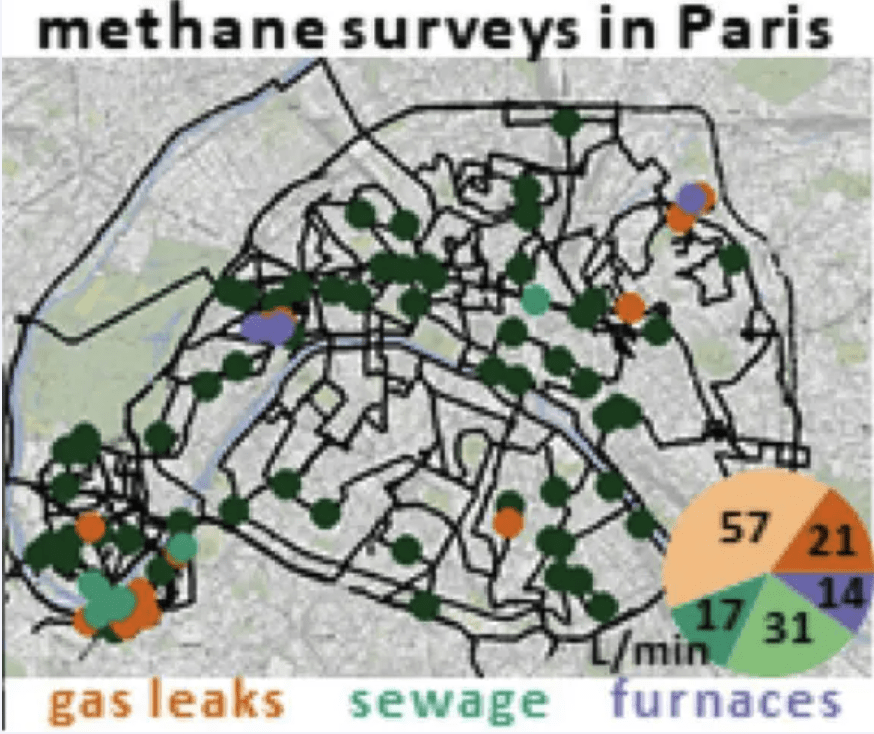
Repeated street-level measurements of methane sources and isotopic composition in Paris showed that leaks from natural gas distribution networks were the main source of methane emissions, followed by leaks from sewage systems and gas-fired furnaces in buildings. The findings and low-cost measurement method can be used to verify the effectiveness of reduction efforts.
Abstract
Megacities, with their large and complex infrastructures, are significant sources of methane emissions. To develop a simple, low-cost methodology to quantify these globally important methane sources, this study focuses on mobile measurements of methane (CH4) and its isotopic composition in Paris. Data collected between September 2018 to March 2019 resulted in 17 days of measurements, which provided spatial distribution of street-level methane mixing ratios, source type identification, and emission quantification. Consequently, 90 potential leaks were detected in Paris sorted into three leak categories: natural gas distribution network emissions (63%), sewage network emissions (33%), and emissions from heating furnaces of buildings (4%). The latter category has not previously been reported in urban methane studies. Accounting for the detectable emissions from the ground, the total estimated CH4 emission rate of Paris was 5000 L/min (190 t/yr), with the largest contribution from gas leaks (56%). This ranks Paris as a city with medium CH4 emissions. Two areas of clusters were found, where 22% and 56% of the total potential emissions of Paris were observed. Our findings suggest that the natural gas distribution network, the sewage system, and furnaces of buildings are ideal targets for street-level CH4 emission reduction efforts for Paris.
Midstream / Downstream
Methane mapping, emission quantification, and attribution in two European cities: Utrecht (NL) and Hamburg (DE)
Maazallahi, H., Fernandez, J. M., Menoud, M., Zavala-Araiza, D., Weller, Z. D., Schwietzke, S., von Fischer, J. C., Denier van der Gon, H., and Röckmann, T.
Atmospheric Chemistry and Physics, 20, 14717–14740, 2020 (December 2020)

A team of scientists took street-level measurements, using instruments installed in a car, to identify and quantify methane emission sources in Utrecht and Hamburg with a focus on natural gas pipeline leaks. They found that a few large sources were responsible for a significant proportion of methane emissions from fossil fuel sources. The measurements resulted in leak repairs by the local utility.
Abstract
Characterizing and attributing methane (CH4) emissions across varying scales are important from environmental, safety, and economic perspectives and are essential for designing and evaluating effective mitigation strategies. Mobile real-time measurements of CH4 in ambient air offer a fast and effective method to identify and quantify local CH4 emissions in urban areas. We carried out extensive campaigns to measure CH4 mole fractions at the street level in Utrecht, the Netherlands (2018 and 2019), and Hamburg, Germany (2018). We detected 145 leak indications (LIs; i.e., CH4 enhancements of more than 10 % above background levels) in Hamburg and 81 LIs in Utrecht. Measurements of the ethane-to-methane ratio (C2:C1), methane-to-carbon dioxide ratio (CH4: CO2), and CH4 isotope composition (δ13C and δD) show that in Hamburg about 1∕3 of the LIs, and in Utrecht 2∕3 of the LIs (based on a limited set of C2:C1 measurements), were of fossil fuel origin. We find that in both cities the largest emission rates in the identified LI distribution are from fossil fuel sources. In Hamburg, the lower emission rates in the identified LI distribution are often associated with biogenic characteristics or (partly) combustion. Extrapolation of detected LI rates along the roads driven to the gas distribution pipes in the entire road network yields total emissions from sources that can be quantified in the street-level surveys of 440±70 t yr−1 from all sources in Hamburg and 150±50 t yr−1 for Utrecht. In Hamburg, C2:C1, CH4: CO2, and isotope-based source attributions show that 50 %–80 % of all emissions originate from the natural gas distribution network; in Utrecht more limited attribution indicates that 70 %–90 % of the emissions are of fossil origin. Our results confirm previous observations that a few large LIs, creating a heavy tail, are responsible for a significant proportion of fossil CH4 emissions. In Utrecht, 1∕3 of total emissions originated from one LI and in Hamburg >1/4 from two LIs. The largest leaks were located and fixed quickly by GasNetz Hamburg once the LIs were shared, but 80 % of the (smaller) LIs attributed to the fossil category could not be detected and/or confirmed as pipeline leaks. This issue requires further investigation.
Midstream / Downstream
Investigation of the Spatial Distribution of Methane Sources in the Greater Toronto Area Using Mobile Gas Monitoring Systems
Sebastien Ars, Felix Vogel, Colin Arrowsmith, Sajjan Heerah, Emily Knuckey, Juliette Lavoie, Christopher Lee, Nasrin Mostafavi Pak, Jaden L. Phillips and Debra Wunch
Environmental Science & Technology 2020 54, 24, 15671-15679 (November 2020)
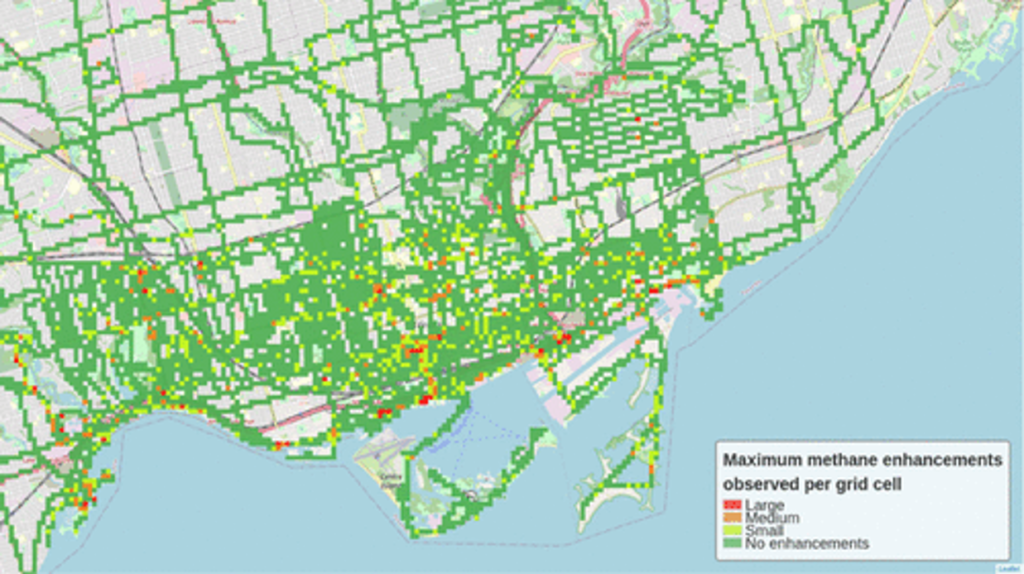
Bicycle and car-based measurements of methane in the Great Toronto area confirmed that inactive landfills are the largest methane sources, albeit below inventory estimates. Toronto’s relatively new gas distribution infrastructure showed lower leakage rates than overall US city data, which shows gas distribution as the main source of methane emissions.
Abstract
For methane emission reduction strategies in urban areas to be effective, large emitters must be identified. Recent studies in U.S. cities have highlighted the contribution of methane emissions from natural gas distribution networks and end use. We present a methane emission source identification and quantification method for the Greater Toronto Area (GTA), the largest metropolitan area in Canada, using mobile gas monitoring systems. From May 2018 to August 2019, we collected 77 surveys of methane mixing ratios, covering a distance of about 6400 km, and sampled emission plumes from sources such as closed landfills, natural gas compressor stations, and waterways. Our results indicate that inactive landfills emit less than inventory estimates. Despite this discrepancy, we confirm that the waste sector is the largest methane emitter in the GTA. We also report that the frequency of methane leaks from the local distribution system ranges between 4 and 22 leaks per 100 km of roadway in downtown Toronto, which is comparable to the range observed in U.S. cities, which have invested in modern natural gas distribution infrastructure. Last, we find that engineered waterways, whose emissions are currently not reported in inventories, may be a significant source of methane.
North Sea
Facility level measurement of offshore oil and gas installations from a medium-sized airborne platform: method development for quantification and source identification of methane emissions
James L. France, Prudence Bateson, Pamela Dominutti, Grant Allen, Stephen Andrews, Stephane Bauguitte, Max Coleman, Tom Lachlan-Cope, Rebecca E. Fisher, Langwen Huang, Anna E. Jones, James Lee, David Lowry, Jospeh Pitt, Ruth Purvis, John Pyle, Jacob Shaw, Nicola Warwick, Alexandra Weiss, Shone Wilde, Jonathan Witherstone and Stuart Young
Atmospheric Chemistry and Physics 4, 71-88 (January 2021)

A new airborne technique and experimental methodologies were used to identify and measure specific sources of methane emissions from UK and Dutch facilities in the southern North Sea. The aim was to identify the strengths and weakness of this methodology by comparing measurements with estimates from inventories, distinguishing between emissions from flaring, venting, combustion and leaks and estimating total methane emissions for the region. The authors identified possible solutions to handle the challenge of the complex meteorological conditions during offshore surveys that were the biggest challenge to obtaining valuable results.
Abstract
Emissions of methane (CH4) from offshore oil and gas installations are poorly ground-truthed, and quantification relies heavily on the use of emission factors and activity data. As part of the United Nations Climate & Clean Air Coalition (UN CCAC) objective to study and reduce shortlived climate pollutants (SLCPs), a Twin Otter aircraft was used to survey CH4 emissions from UK and Dutch offshore oil and gas installations. The aims of the surveys were to (i) identify installations that are significant CH4 emitters, (ii) separate installation emissions from other emissions using carbon-isotopic fingerprinting and other chemical proxies, (iii) estimate CH4 emission rates, and (iv) improve flux estimation (and sampling) methodologies for rapid quantification of major gas leaks. In this paper, we detail the instrument and aircraft setup for two campaigns flown in the springs of 2018 and 2019 over the southern North Sea and describe the developments made in both the planning and sampling methodology to maximise the quality and value of the data collected. We present example data collected from both campaigns to demonstrate the challenges encountered during offshore surveys, focussing on the complex meteorology of the marine boundary layer and sampling discrete plumes from an airborne platform. The uncertainties of CH4 flux calculations from measurements under varying boundary layer conditions are considered, as well as recommendations for attribution of sources through either spot sampling for volatile organic compounds (VOCs) / δ13CCH4 or using in situ instrumental data to determine C2H6–CH4 ratios. A series of recommendations for both planning and measurement techniques for future offshore work within marine boundary layers is provided.
Mexico
A tale of two regions: methane emissions from oil and gas production in offshore/onshore Mexico
Daniel Zavala-Araiza, Mark Omara, Ritesh Gautam, Mackenzie L Smith, Sudhanshu Pandey, Ilse Aben, Victor Almanza-Veloz, Stephen Conley, Sander Houweling, Eric A Kort, Joannes D Maasakkers, Luisa T Molina, Abhinand Pusuluri, Tia Scarpelli, Stefan Schwietzke, Lu Shen, Miguel Zavala and Steven P Hamburg
Environmental Research Letters 16 (2021) 024019 (January 2021)
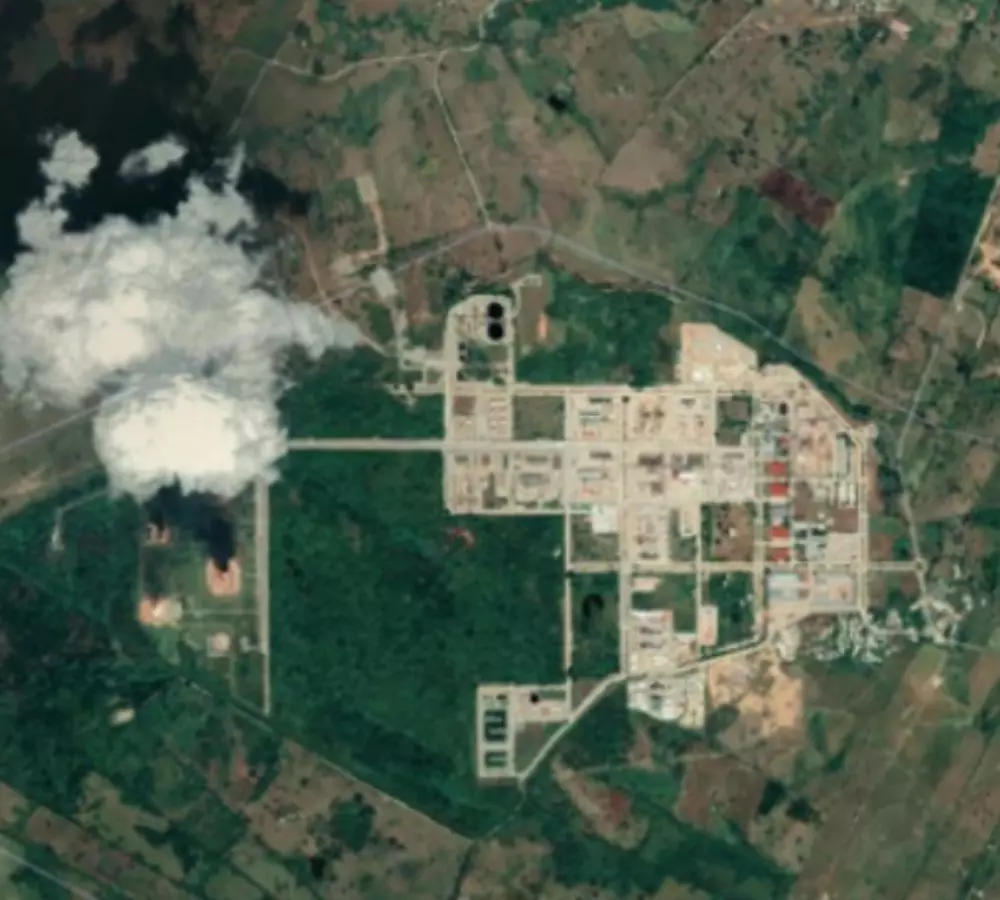
Aircraft-based measurements of Mexico’s key onshore and offshore oil and gas facilities showed that offshore methane emissions are considerably lower than estimated, while onshore emissions are considerably higher. One single onshore facility, processing offshore associated gas, emitted more than the largest offshore region, largely due to flaring. Satellite data over two years confirmed this pattern, but suggest even higher onshore emissions than aircraft data. This work highlights the need to shift away from using generic emissions factors in estimating methane emissions, if effective mitigation is to be undertaken.
Abstract
We use atmospheric observations to quantify methane (CH4) emissions from Mexico’s most important onshore and offshore oil and gas production regions which account for 95% of oil production and 78% of gas production. We use aircraft-based top-down measurements at the regional and facility-levels to determine emissions. Satellite data (TROPOMI CH4 data and VIIRS night-time flare data) provide independent estimates of emissions over 2 years. Our airborne estimate of the offshore region’s emissions is 2800 kg CH4 h −1 (95% confidence interval (CI): 1700–3900 kg CH4 h −1), more than an order of magnitude lower than the Mexican national greenhouse gas inventory estimate. In contrast, emissions from the onshore study region are 29 000 kg CH4 h −1 (95% CI: 19 000–39 000 kg CH4 h −1), more than an order of magnitude higher than the inventory. One single facility—a gas processing complex that receives offshore associated gas—emits 5700 kg CH4 h −1 (CI: 3500–7900 kg CH4 h −1), with the majority of those emissions related to inefficient flaring and representing as much as half of Mexico’s residential gas consumption. This facility was responsible for greater emissions than the entirety of the largest offshore production region, suggesting that offshore-produced associated gas is being transported onshore where it is burned and in the process some released to the atmosphere. The satellite-based data suggest even higher emissions for the onshore region than did the temporally constrained aircraft data (>20 times higher than the inventory). If the onshore production region examined is representative of Mexican production generally, then total CH4 emissions from Mexico’s oil and gas production would be similar to, or higher than, the official inventory, despite the large overestimate of offshore emissions. The main driver of inaccuracies in the inventory is the use of generic, non-Mexican specific emission factors. Our work highlights the need for local empirical characterization of emissions if effective emissions mitigation is to be undertaken.