Updated for 2024 – See OGCI’s new Performance Data hub for latest data
OGCI has been collecting aggregate data across all member companies since 2017.
In line with best practice, we are continually improving data collection methodologies and processes in areas such as flaring, investment and research and development (R&D) in low-carbon technologies as well as adding new aggregate indicators as they become relevant.
This year, for the first time, we are publishing greenhouse gas emissions data on an equity basis to complement operated data. Eleven of our 12 companies reported data for Scope 1 and 2 equity greenhouse gas emissions – one more than last year, which was the first year we collected the data.
EY, an independent third party collects and reviews OGCI data.
In 2023, EY issued a limited assurance statement, as it has done in previous years. This year the EY statement covers nine companies’ data for 2022 (see statement page 29). This year, EY increased the requirements for assurance in line with evolving auditing standards.
Abbreviations
Mboe/day
Million barrels of oil equivalent per day
kgCO22e/boe
Kilograms of carbon dioxide equivalent per barrels of oil equivalent
MtCO22e
Million tonnes of carbon dioxide equivalent
MtCH4
Million tonnes of methane
Mm3
Million cubic metres
All reported data is the aggregate for 12 companies unless otherwise stated.
Note: Our member companies are continually improving their own reporting methodologies. As a result, the published data for 2020 and 2021 incorporates some methodological changes and may differ slightly from those previously reported. Read more about OGCI’s definitions and methodology in the OGCI Reporting Framework
With six years of aggregated operated data now available, we can see some clear trends across our members:
- Greenhouse gas emissions are continuing to decrease and OGCI members are on track to achieve the group’s collective 2025 upstream carbon intensity target. Aggregated upstream carbon intensity at operated assets is 21% lower than it was in 2017, largely due to reductions in methane and flaring emissions and an increase in renewable sourcing and portfolio changes.
- Investment in low carbon technologies, including acquisitions and R&D, has risen steadily since 2017 and was up 66% in 2022 vs 2021. In 2022, OGCI member companies invested $24.3 billion on low-carbon technologies – almost 70% more than spending in the previous year.
Renewable energy technologies such as wind and solar accounted for the largest share, while spending on carbon capture, utilization and storage tripled since 2021.
Since 2017, OGCI members have cumulatively spent $65 billion on low carbon technologies (including acquisitions and R&D).
- Since 2017, operated absolute upstream methane emissions and flared volumes have halved. The volume of methane emissions reductions across all relevant operated sectors since 2017 is 1.1 million tonnes of methane. This is equivalent to removing the emissions of almost 7 million gasoline-powered passenger vehicles for one year.1
This progress supports OGCI member companies aim to reach near zero methane emissions by 2030 from operated oil and gas assets in line with the Aiming for Zero Methane Emissions initiative OGCI launched in 2022.
Production
Aggregate operated oil and gas production from the 12 OGCI member companies remained steady in 2022 at 43.9 Mboe/day. Oil production rose 2% compared with the previous year, while gas production fell 1%. Production trends across the companies were mixed.
In 2022, oil production was overall slightly higher on the year as decreased output at most of the companies was offset by an increase at the remainder amid disruptions to global energy markets following Russia’s invasion of Ukraine. Gas production decreased slightly as some companies divested assets.
Since 2017, oil production has fallen 5% while gas production has risen 2%. The share of gas has now risen to 35.3% of aggregate operated oil and gas production. OGCI member companies operated 27% of global oil and gas production in 2022.2
Loading..........
The Data is Not Available
Notes:
- 2020 and 2021 data restated
Greenhouse gas emissions (operated)
Upstream carbon intensity is on track to achieve OGCI’s 2025 target of 17 kg/boe. In 2022, it fell to 18 kg/boe, a 6% decrease compared to the previous year. This brings the total reduction in carbon intensity since 2017 to 21%.
Reductions in absolute greenhouse gas emissions at operated assets fell by 5% in 2022 in line with the reduction in upstream carbon intensity.
Scope 1 upstream greenhouse gas emissions fell by 5% over the year (and a total of 22% since 2017), due to factors including a reduction in flaring, vent recovery projects and portfolio changes.
Scope 2 upstream greenhouse gas emissions fell by 5% over the year (and a total of 12% since 2017), mainly due to an increase in renewable sourcing and divestments.
Downstream, which accounts for around half of OGCI member companies’ aggregate Scope 1 greenhouse gas emissions, has shown slower progress than upstream, reflecting the complexity and longer timelines of decarbonization efforts in refineries and chemical facilities.
In 2022, OGCI members’ aggregate greenhouse gas emissions (Scope 1 operated) including upstream and downstream was 590 MtCO22e. This represents 1.1% of global greenhouse gas emissions, using latest 2021 data from UNEP’S Emissions Gap Report for 2022.3
Loading..........
The Data is Not Available
Notes:
- This is the key performance indicator for OGCI’s upstream carbon intensity target. It includes upstream carbon dioxide and methane emissions, both Scope 1 and 2, on an operated basis. It excludes emissions from gas liquefaction and gas-to-liquids.
- This figure includes direct (Scope 1) emissions of carbon dioxide, methane and nitrous oxide (for those companies that report it) from all operated activities (upstream as well as downstream, which includes refineries and petrochemicals). The methane emissions were converted to CO2 equivalent using a 100-year time horizon global warming potential (GWP) of 25 for fossil-based methane as per IPCC AR4. Using the IPCC AR6 GWP of 29.8, the operated greenhouse gas emissions were 595 MtCO2e in 2022.
- Upstream activities comprise all operations from exploration to production and gas processing (up to the first point of sale), including LNG liquefaction plants if located before the first point of sale.
- Scope 2 emissions were not calculated in a homogenous way across companies, with some using a location-based and others a market-based methodology.
- 2020 and 2021 data restated for “upstream carbon intensity”,”operated greenhouse gas emissions – all sectors (Scope 1)” and “of which: upstream emissions (Scope 1).”
Greenhouse gas emissions (equity)
Loading..........
The Data is Not Available
Notes:
- 2021 data restated
Methane emissions (operated)
OGCI members reported an aggregate upstream operated methane intensity of 0.15% in 2022, a 17% decrease over the year and half the level seen in 2017. OGCI members had already achieved their collective methane intensity target of well below 0.2% in 2021 – four years early.
Absolute upstream methane emissions decreased by 17% in 2022 compared with 2021 and 50% since 2017. The reduction is mainly a result of widescale equipment and system upgrades, improved flaring controls, continued leak detection and repair, and improved calculation methodologies. Divestment of assets also played a role for some companies.
The upstream sector accounted for 93.7% of OGCI total methane emissions in 2022. Venting and fugitive leaks accounted for over 66.7% of total upstream methane emissions.
OGCI member companies are striving to reach near zero methane emissions from their operated assets by 2030 through the Aiming for Zero Methane Emissions initiative launched by OGCI. They are sharing what they are learning about detection, measurement and abatement across the industry.
Loading..........
The Data is Not Available
Notes:
- This is the key performance indicator for OGCI’s 2025 upstream methane target of well below 0.2%. It includes total upstream methane emissions from all operated gas and oil assets. Emissions intensity is calculated as a share of marketed gas.
- This figure includes relevant operated activities (upstream, refineries, petrochemicals, power generation, etc, where these are operated by the company).
- 2020 and 2021 data restated.
Flaring (operated)
OGCI member companies continued to reduce flaring volumes and related greenhouse gas emissions from flaring in 2022, in line with their commitment to end upstream routine flaring and achieve near zero methane emissions by 2030.
In 2022, upstream flaring intensity fell by 21% on the year, accompanying an 18% reduction in upstream
flaring emissions.
Routine flaring volumes in upstream fell in 2022 compared with the previous year as one less company reported data.
In the period, some of the reduction was attributed to improved production practices such as flaring reductions for targeted assets, flare gas recovery systems, gas compression and capture projects.
Since 2017, upstream flaring of greenhouse gas emissions have decreased by 45%.
Loading..........
The Data is Not Available
Notes:
- Upstream flaring intensity is calculated on the basis of the volume of gas flared per millions tonnes of oil equivalent produced on an operated basis.
- 2020 data restated “for upstream flaring intensity” and “natural gas flared – upstream.”
- 2021 data restated.
Investment and R&D in low carbon technologies
Aggregate OGCI data on low-carbon investment, including acquisitions and R&D includes between nine and 11 companies. These companies reported investments totalling $24.3 billion in 2022, an increase of 66% compared with 2021.
Renewable energy accounted for more than half of the low-carbon investment and comprised the bulk of the acquisition spend. Organic investment in CCUS almost tripled over the year, with most OGCI members investing in the technology as part of their decarbonization strategies.
R&D spending on low carbon technologies continued to grow in 2022 with a 38% increase in absolute terms over the year and accounting for 32% of total R&D spend – double the share in 2021.
The total spend on low carbon technologies and projects, including investment, R&D and acquisitions, amounted to $65 billion since 2017.
Number of companies:
Loading..........
The Data is Not Available
Notes:
Low carbon energy technologies include but are not limited to wind, solar and other renewable energies, carbon-efficient energy management, CCUS, blue and green hydrogen, biofuels, synfuels, energy storage and sustainable mobility.
R&D spending is additional to investment.
- 2020 data restated for “investment in low carbon technologies” restated.
- 2021 data restated for “investment in low carbon technologies” and “low carbon R&D as share of total R&D spend.”
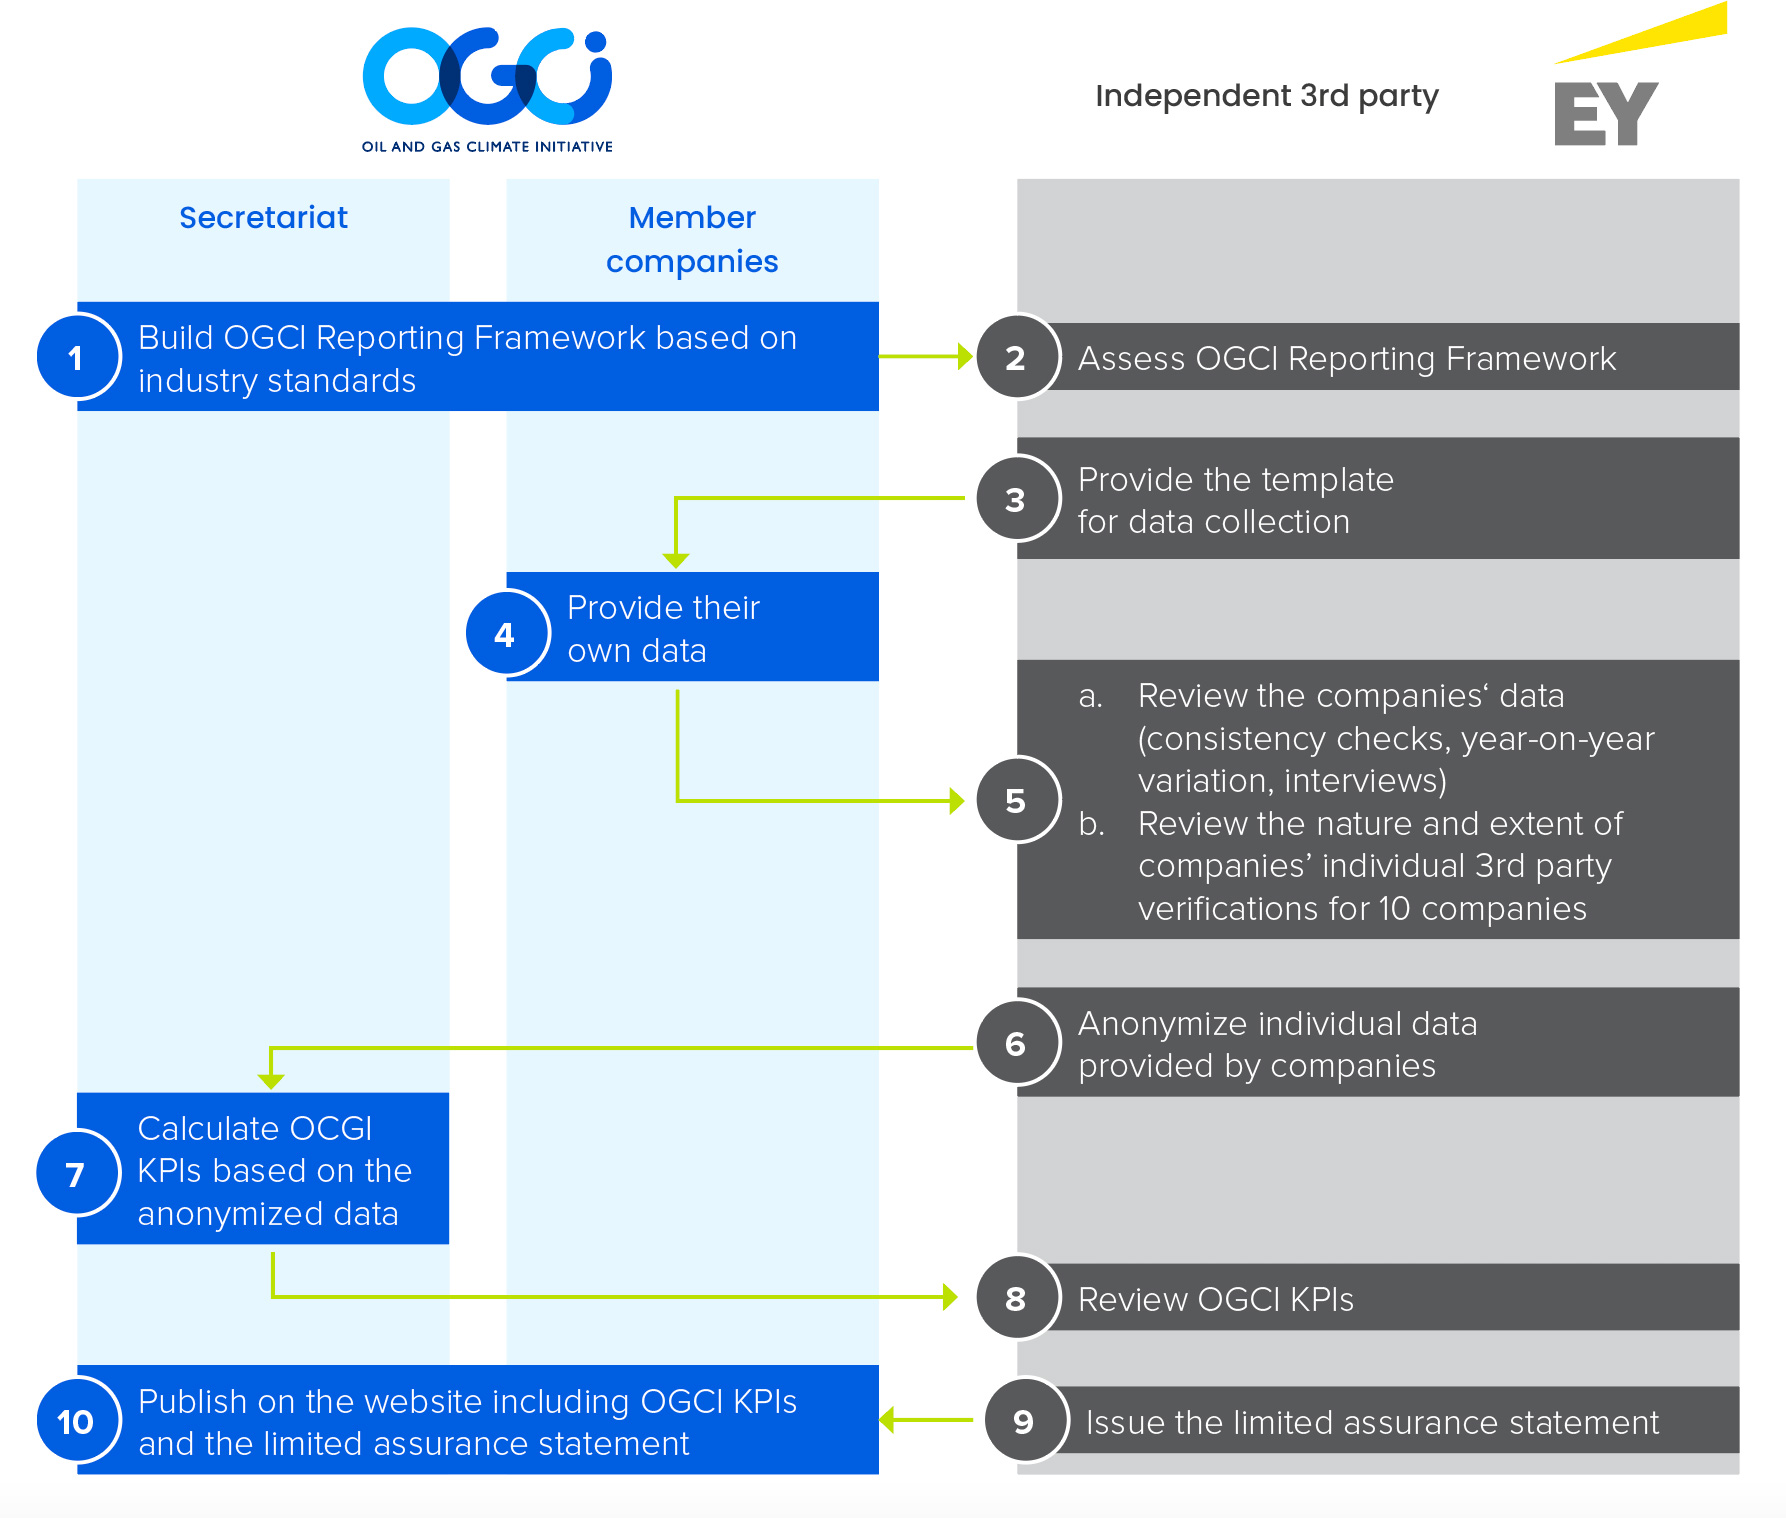
OGCI and EY data consolidation and review process
Since 2016, OGCI has been working with EY & Associés (EY), as an independent third party, to collect and check data consistency, and guarantee the confidentiality of member companies’ data.
We developed together with EY an innovative process, applicable to both listed and state-owned national oil companies, to aggregate information about the level of third-party assurance that member companies apply individually into OGCI data reporting.
Most OGCI member companies already ensure that data reported to OGCI are independently verified. This additional step confirms that OGCI data, as well as information about third-party data assurance, are consolidated, reviewed and challenged in order to increase the reliability of the aggregate data we publish.
Since 2020, we have worked with EY to develop and implement a verification process for a selection of our aggregate data.
EY’s statement this year covers nine of OGCI’s 12 members.
Our process for data consolidation and review
Independent verifier’s report on a selection of indicators for calendar year ended December 31, 2022
Further to OGCI Climate Investment LLP’s request, on behalf of OGCI, and in our capacity as independent verifier, member of the EY network, statutory auditor of OGCI Climate Investment LLP, we hereby present our report on a selection of OGCI indicators (the “OGCI Indicators”) for the year ended December 31, 2022 detailed in Appendix 1, that OGCI has selected, prepared and presented on its website.
Qualification
We had access to the nature and extent of third-party verifications conducted at company level on member-company data for only 9 companies out of the 12 OGCI member companies (representing 55% of the “Total Operated greenhouse gas emissions – Scope 1” OGCI Indicators).
Comments
Member companies align their reported data with local methodologies required by local authorities, that may vary depending on geographies.
For methane emission quantification and operated scope 2 greenhouse gas emissions, companies are using different tiered approaches.
Conclusion
Based on our work, described in the “Nature and scope of work” section of this report, except for the matters described above, nothing has come to our attention that causes us to believe that the OGCI Indicators are not presented in accordance with version 3.7 of the OGCI Reporting Framework dated March 2023, in all material respects.
Understanding how OGCI has prepared the OGCI Indicators
The absence of a commonly-used-generally-accepted reporting framework or a significant body of established practice on which to draw, evaluate and measure sustainability information allows for different, but acceptable, measurement techniques that can affect comparability between entities and over time. Consequently, the OGCI Indicators needs to be read and understood together with version 3.7 of the OGCI Reporting Framework dated March 2023, which OGCI has used to prepare the OGCI Indicators.
Responsibility of OGCI
As part of this voluntary approach, it is the responsibility of OGCI to:
- disclose the OGCI Reporting Framework dated March 2023, available on OGCI’s website;
- consolidate the anonymized member companies’ data and ensure their consistency;
- publish the consolidated OGCI Indicators on OGCI’s website.
Responsibility of OGCI’s member companies
As part of this voluntary approach, it is the responsibility of OGCI’s member companies to report to OGCI their data according to the OGCI Reporting Framework dated March 2023 and to disclose to EY the nature and details of the verification performed on their data at member-company level.
Independence and quality control
Our independence is defined by the Code of Ethics of our profession. In addition, we have implemented a quality control system, including documented policies and procedures to ensure compliance with ethical standards, professional standards and applicable laws and regulations.
Responsibility of the independent verifier
It is our responsibility, in response to OGCI’s request, based on our work, to express a limited assurance conclusion on whether the OGCI Indicators have been calculated in accordance with the OGCI Reporting Framework dated March 2023.
It is not our responsibility to give an opinion on the entire annual report or on the compliance of the OGCI Indicators with applicable legal provisions.
Nature and scope of the work
Christophe Schmeitzky
We conducted the work described below in accordance with international standard ISAE 3000 (International Standard on Assurance Engagements) and with professional standards applicable in France.
- We assessed the suitability of the OGCI Reporting Framework dated March 2023 in terms of its relevance, comprehensiveness, reliability, neutrality and understandability by taking into consideration the best practices of the oil and gas industry.
- We conducted the following work related to consistency and arithmetical accuracy of member companies’ data reported by the 12 OGCI member companies with the OGCI Reporting Framework dated March 2023:
- assessment of the appropriate application of the OGCI Reporting Framework dated March 2023 to the member-company data;
- analysis and investigation of member-company data value change in 2022 compared to 2021;
- calculation of consistency ratios and investigation to identify potential outliers among member-company data.
- We conducted a reconciliation between member-company data and publicly-available information.
- We assessed the nature and extent of third-party verification conducted at company level on member-company data against the following topics (hereafter the “Criteria”) through the collection of supporting evidence and interviews with the external third parties of member companies:
- work program;
- assurance standard;
- number of man days;
- physical site visits;
- remote site visits;
- scope 1 operated emissions coverage reached with site level verifications;
- audit findings;
- third party team members’ competencies.
- We conducted interviews with the 12 OGCI member companies.
- We reviewed the consolidation performed by OGCI on the anonymized member-company data.
We consider that the work we have performed by exercising our professional judgment allows us to express a limited assurance conclusion; an assurance of a higher level would have required more extensive verification work.
Paris-La Défense, September 22, 2023
Signed by:
EY & Associés
Partner, Sustainable Development
Christophe Schmeitzky
Percentage of OGCI Indicators considered as reviewed by an external third party and for which the third-party verification work has been shared with EY
Loading..........
The Data is Not Available
Notes:
- An indicator is considered as “reviewed” if it was published in a publicly available document and if it was covered by an opinion or conclusion statement provided by an external third party or was reported to a governmental authority and available to public. None of the opinion/conclusion statements consulted contained any qualification. Only limited and reasonable assurance levels of opinion have been considered.
- The sum of “Operated greenhouse gas emissions – upstream (Scope 1)” and “Operated greenhouse gas emissions – upstream (Scope 2)” indicators correspond to the numerator of the carbon intensity indicator.
- “Operated methane emissions” indicator is considered reviewed if “Operated methane emissions – upstream” are reviewed, as methane emissions mainly occur in upstream activities. “Operated methane emissions” and “Operated methane emissions – upstream” are not automatically considered as reviewed if only the “Greenhouse gas emissions – all sectors” are reviewed (as methane emissions generally represent a minor fraction of total greenhouse gas emissions).
- All indicators are operated. “Operated greenhouse gas emissions – upstream (Scope 1)”, “Operated greenhouse gas emissions – upstream (Scope 2)”, “Natural gas flared – upstream” and “Flaring greenhouse gas emissions – upstream” indicators are considered reviewed if the “Greenhouse gas emissions – all sectors” are reviewed, as they are part of the overall greenhouse gas emissions review.
- Calculated using the US EPA GHG equivalencies calculator
- Provisional estimate of global oil and gas production of roughly 162 Mboe/day in 2022, based on IEA indicators for oil supply of 94.8 Mboe/day and global natural gas production of 67.3 Mboe/day. OGCI member companies’ share of total oil and gas production is 27% on an operated basis and 26% on an equity basis. IEA Oil Market Report (January 2023); IEA 2023 Gas Market Report Q1
- UNEP’S Emissions Gap Report 2022, p34. The 2021 data for Total GHG emissions excluding LULUCF is 52.8GtCO2e