OGCI has been collecting third-party reviewed aggregated emissions data from our member companies and publishing the data in our annual Progress Report since 2017.
Our aggregated Performance Data includes oil and gas production (operated and equity), greenhouse gas emissions (operated and equity), operated upstream carbon intensity, methane emissions and intensity, flaring, and investment, including acquisitions and R&D, in low-carbon technologies. Published data and percentages are rounded. Dollars in this report are USD.
- See Reporting Framework for definitions and methodology.1
- See table notes for reporting scope and boundary.
- Data is reported by 12 companies, unless otherwise stated in parentheses in the tables.
- The data is independently verified and assured by EY.2
Key takeaways
Eight years of data show that OGCI member companies are making progress reducing greenhouse emissions from oil and gas operations under their control and increasing investments in the low-carbon technologies and solutions that will be needed for a net zero emissions future.

Carbon intensity ambition within reach

Routine flaring down 72%
In 2024, OGCI members’ total routine gas flared upstream were down 72% since 2018, (the first year data was published) in line with the group’s ambition to end upstream routine flaring by 2030.3

Methane emissions continue to fall
In 2024, OGCI members’ aggregate operated upstream methane intensity and total operated methane emissions were 62% and 63% lower respectively than in 2017, in line with the group’s ambition to reach near zero methane emissions by 2030.

Low-carbon investment steady
In 2024, OGCI member companies invested $30 billion in low-carbon projects, acquisitions and R&D. This takes OGCI member companies’ cumulative low-carbon investment to $125 billion since 2017.
Abbreviations
Mboe/day
Million barrels of oil equivalent per day
kgCO2e/boe
Kilograms of carbon dioxide equivalent per barrel of oil equivalent
Million tonnes of carbon dioxide equivalent
Million tonnes of methane
Million cubic metres
Production

Total operated oil and gas production in 2024
of global oil and gas production in 2024
Share of natural gas in operated portfolio in 2024
In 2024, aggregate operated oil and gas production from OGCI’s 12 member companies was 3% higher year-on-year at 42.2 Mboe/day. OGCI member companies produced 25% of global oil and gas from operated assets in 2024.4
The increase in operated oil and gas production was driven by four companies, thanks in part to acquisitions at two companies, a change in operational control at a third company and new wells and startups at a fourth company.
This helped offset a decrease in operated production at four companies, driven by divestments, maintenance stops and a natural decline in production at one company.
Operated oil production increased 2% compared with the previous year, while operated gas production was 3% higher.
Operated gas production was higher, primarily due to acquisitions at three companies and a significant increase in output at one company.
| OGCI indicators | Units | 2017 | 2018 | 2019 | 2020 | 2021 | 2022i | 2023i | 2024 | 2023-2024 | 2017-2024 |
| Total OGCI oil and gas production (operated) | Mboe/day | 45.0 | 45.6 | 45.8 | 43.5 | 43.5 | 42.2 | 41.3 | 42.2 | 3% | -6% |
| Total OGCI oil production (operated) | Mboe/day | 29.8 | 29.9 | 29.7 | 28.4 | 27.9 | 27.8 | 27.3 | 27.8 | 2% | -7% |
| Total OGCI gas production (operated) | Mboe/day | 15.2 | 15.7 | 16.1 | 15.1 | 15.6 | 14.4 | 14.0 | 14.4 | 3% | -5% |
| Share of natural gas in operated portfolio | % | 34% | 34% | 35% | 35% | 36% | 34% | 34% | 34% | 1% | 1% |
| Total oil and gas production (equity) | Mboe/day | 42.5 | 42.4 | 42.9 | 41.6 | 41.1 | 41.7 | 41.0 | 35.7 (11) | -13% | -16% |
i. 2022 and 2023 data restated.
GHG emissions (operated)

Upstream carbon intensity in 2024
Upstream carbon intensity
2024 vs 2017
Upstream operated Scope 1 and 2 GHG emissions in 2024
In 2024, OGCI’s member companies were close to achieving the group’s ambition to reduce upstream operated carbon intensity to 17.0 kg CO2e/boe by 2025.
In 2024, OGCI members’ aggregate upstream operated carbon intensity was 17.2 kg CO2e/boe, a 1% increase compared to the previous year and 24% lower than in 2017.
In 2024, OGCI members’ aggregate upstream operated Scope 1 and 2 GHG emissions were 304 Mt CO2e. This represents 0.5% of global GHG, using latest 2023 data from UNEP’S Emissions Gap Report published in 2024.5
In 2024, OCGI members’ aggregate upstream operated Scope 1 and 2 GHG emissions were 25% lower than in 2017 due to methane emissions reductions, energy efficiency investments, projects to reduce carbon emissions in exploration and production, and divestments.
Upstream operated Scope 1 GHG emissions were 260 Mt in 2024. The 1% decrease year-on-year was driven mostly by GHG reduction measures such as pneumatic device conversions, energy efficiency investments and carbon footprint reduction projects at four companies.
OGCI members’ aggregate upstream operated Scope 2 GHG emissions were 44.5 Mt, up 17% over the year. This was mainly due to more companies reporting this year than last.
In 2024, OGCI members’ total operated Scope 1 GHG emissions from all sectors (including upstream and downstream) was 543 Mt CO2e, a 3% decrease year-on-year.
OGCI members’ total operated Scope 1 GHG emissions from all sectors (including upstream and downstream) was 23% lower than in 2017.
Downstream, which accounts for around half of OGCI member companies’ aggregate Scope 1 GHG emissions, has shown slower progress than upstream, reflecting the complexity and longer timelines of emissions reduction efforts in refineries.
| OGCI indicators | Units | 2017 | 2018 | 2019 | 2020 | 2021 | 2022i | 2023i | 2024 | 2023-2024 | 2017-2024 |
| Upstream operated carbon intensityii | kgCO2e/boe | 22.7 | 22.1 | 21.3 | 20.4 | 19.2 | 19.4 (5) | 17.1 (7) | 17.2 (10) | 1% | -24% |
| Total operated GHG emissions – all sectors (Scope 1)iii | MtCO2e | 709 | 687 | 684 | 633 | 621 | 575 | 558 | 543 | -3% | -23% |
| Upstream operated GHG emissions (Scope 1)iv | MtCO2e | 362 | 349 | 343 | 311 | 298 | 268 | 261 | 260 | -1% | -28% |
| Upstream operated GHG emissions (Scope 2)v | MtCO2e | 41.4 | 43.5 | 43.7 | 39.4 | 38.2 | 37.9 (10) | 38.2 (10) | 44 | 17% | 7% |
i. 2022 and 2023 data restated.
ii. This is the key performance indicator for OGCI’s upstream carbon intensity ambition. It includes upstream carbon dioxide and methane emissions, both Scope 1 and 2, on an operated basis. It excludes emissions from gas liquefaction and gas-to-liquids. This indicator has been calculated with a mixed approach combining market-based and location-based methodologies with market-based priority from 2017 to 2021, and calculated using a market-based only approach from 2022.
iii. Numbers are rounded. This figure includes direct (Scope 1) emissions of carbon dioxide, methane and nitrous oxide (for those companies that report it) from all operated activities (upstream as well as downstream, which includes refineries and petrochemicals). The methane emissions were converted to CO2 equivalent using different global warming potentials (GWP) depending on the company. Most of the companies applied a GWP of 30 (IPCC AR5) in 2024. Using the IPCC AR6 GWP of 29.8, the operated greenhouse gas emissions were 561 MtCO2e in 2023 and 544 MtCO2e in 2024.
iv. Upstream activities comprise all operations from exploration to production and gas processing (up to the first point of sale), including LNG liquefaction plants if located before the first point of sale.
v. Scope 2 emissions were not calculated in a homogenous way across companies from 2017-2021 as some used a location-based methodology and others used market-based. From 2022, Scope 2 emissions are disclosed using the location-based methodology.
GHG emissions (equity)
Scope 1 equity GHG emissions in 2024
Methane is reported by 9 companies in 2024 vs 10 in 2023.
Scope 2 equity GHG emissions in 2024
Total equity methane emissions in 2024
This is the fourth year of OGCI published data on equity emissions, in line with OGCI’s ambition of greater transparency in emissions reporting.
Equity reporting includes emissions from assets owned, even where they are operated by partners.
In 2024, total GHG emissions on an equity basis for Scope 1 and Scope 2 were 429 Mt CO2e and 46 Mt CO2e respectively. This was due to 10 companies reporting in 2024 compared with 11 in 2023.
In 2024, total Scope 1 equity GHG emissions decreased by 25% year-on-year due to the fact that one company did not report any data in 2024. Scope 2 equity GHG emissions were down 47% for the same reason.
Total methane emissions on an equity basis were 0.45 Mt of methane in 2024, a 51% decrease compared with the previous year as 9 companies reported in 2024 compared with 10 in 2023.
| OGCI indicators | Units | 2017 | 2018 | 2019 | 2020 | 2021 | 2022i | 2023i | 2024 | 2023-2024 | 2017-2024 |
| Total equity GHG emissions (Scope 1) | MtCO2e | N/A | N/A | N/A | N/A | 562 | 596 (11) | 575 (11) | 429 (10) | -25% | -24% |
| Total equity GHG emissions (Scope 2) | MtCO2e | N/A | N/A | N/A | N/A | 69 | 83 (11) | 86 (11) | 46 (10) | -47% | -34% |
| Total equity methane emissions | MtCH4 | N/A | N/A | N/A | N/A | 1.13 | 0.95 (9) | 0.92 (10) | 0.45 (9) | -51% | -60% |
| Equity methane emissions – upstream | MtCH4 | N/A | N/A | N/A | N/A | 1.09 | 0.91 (11) | 0.85 (11) | 0.39 (9) | -54% | -64% |
i. 2022 and 2023 data restated. OGCI began publishing equity emissions data in 2023, starting with 2021 data.
Methane emissions (operated)

Upstream methane intensity in 2024
Upstream methane intensity
2024 vs 2017
Total operated upstream methane emissions
2024 vs 2017
OGCI members reported an aggregate upstream operated methane intensity of 0.12% in 2024, as the group’s methane intensity continued to trend lower due to measures taken by the companies.
OGCI members’ aggregate upstream operated methane intensity is 62% lower compared with 2017.
OGCI members had already achieved their collective methane intensity ambition of well below 0.20% in 2021 – four years early.
In 2024, upstream operated methane emissions were 0.73 Mt of methane. This represents a 16% decrease compared with 2023 and a 63% decrease compared with 2017.
The year-on-year reduction is mainly a result of the continuation of methane reduction projects that include conversion of pneumatic devices, and flaring reduction projects.
The upstream sector accounted for around 93% of OGCI member companies’ total methane emissions in 2024. Venting and fugitive emissions accounted for about 25% of total aggregated upstream methane emissions.
OGCI member companies are working to reach near zero methane emissions from their operated assets by 2030. They are sharing what they are learning about detection, measurement and abatement across the industry.
| OGCI indicators | Units | 2017 | 2018 | 2019 | 2020 | 2021 | 2022i | 2023i | 2024 | 2023-2024 | 2017-2024 |
| Upstream operated methane intensityii | % | 0.30 | 0.25 | 0.23 | 0.21 | 0.17 | 0.15 | 0.14 | 0.12 | -20% | -62% |
| Total operated methane emissions – all sectorsiii | MtCH4 | 2.10 | 1.90 | 1.70 | 1.40 | 1.25 | 1.01 | 0.95 | 0.78 | -17% | -63% |
| Total operated methane emissions – upstream | MtCH4 | 1.95 | 1.70 | 1.60 | 1.30 | 1.16 | 0.95 | 0.87 | 0.73 | -16% | -63% |
i. 2022 and 2023 data restated.
ii. This is the key performance indicator for OGCI’s 2025 upstream methane ambition of well below 0.20%. It includes total upstream methane emissions from all operated gas and oil assets. Emissions intensity is calculated as a share of marketed gas.
iii. This figure includes relevant operated activities (upstream, refineries, petrochemicals, power generation, etc).
Flaring (operated)

Upstream flaring intensity
2024 vs 2017
Total routine flared gas upstream
2024 vs 2018
GHG emissions from upstream flaring
2024 vs 2017
OGCI member companies continued to reduce flaring volumes and related greenhouse gas emissions from flaring in 2024, in line with their ambition to end upstream routine flaring by 2030.6
In 2024, OGCI members’ aggregate upstream flaring intensity was 9% lower year-on-year due to a 7% decrease in volumes of natural gas flared upstream and a 17% decrease in routine gas flared volumes in the same period.
The year-on-year decrease in volumes of natural gas flared upstream was driven by divestments, a reduction in upstream routine flaring, better performance of assets and fewer outages for two companies and extensive maintenance at fields and plants at one company.
Routine gas flared volumes are down 72% since 2018 due to improved production practices, such as flaring reductions for targeted assets, flare gas recovery systems, additional gas compression and capture projects.
In 2024, GHG emissions from upstream flaring were 3% lower than in 2023 and 55% lower than in 2017.
In 2024, upstream flaring intensity was 53% lower than in 2017.
| OGCI indicators | Units | 2017 | 2018 | 2019 | 2020 | 2021 | 2022i | 2023i | 2024 | 2023-2024 | 2017-2024 |
| Upstream flaring intensityii | Mm3/Mtoe | 10.8 | 9.5 | 9.2 | 7.6 | 7.4 | 5.6 | 5.6 | 5.1 | -9% | -53% |
| Total natural gas flared – upstream | Mm3 | 24,221 | 21,465 | 20,998 | 16,490 | 15,998 | 11,749 | 11,531 | 10,748 | -7% | -56% |
| Total routine gas flared – upstream | Mm3 | N/A | 5,636 (10) | 4,871 (10) | 4,250 (11) | 4,165 | 2,187 (11) | 1,892 (11) | 1,568 (11) | -17% | -72%iii |
| Flaring GHG emissions – upstream | MtCO2e | 62 | 57 | 55 | 44 | 42 | 30 | 28 | 28 | -3% | -55% |
i. 2022 and 2023 data restated.
ii. Upstream flaring intensity is calculated on the basis of the volume of gas flared per million tonnes of oil equivalent produced on an operated basis.
iii. Percentage reduction is from 2018, the first year data was published for this metric, and 2024.
Investment and R&D in low-carbon technologies

Total low-carbon investment in 2024
includes low-carbon projects, acquisitions and R&D
Cumulative low-carbon investment
since 2017
R&D spend
2024 vs 2023
In 2024, OGCI member companies’ aggregate low-carbon investment, including acquisitions, and research and development (R&D) totaled $30 billion.
This figure reflects a 13% increase year-on-year in investment in low-carbon projects and a 19% increase in low-carbon R&D as spending on acquisitions fell.
Investment in CCUS continued to grow with some companies concentrating on the technology as part of their strategies to reduce emissions.
R&D spending on low-carbon technologies increased 19% in 2024 versus the previous year to $2.3 billion and comprised 39% of total R&D spend.
Since 2017, OGCI member companies’ cumulative investment in low-carbon technologies and projects, including investment, R&D and acquisitions, amounted to $125 billion.
| OGCI indicators | Units | 2017 | 2018 | 2019 | 2020 | 2021 | 2022i | 2023i | 2024 | 2023-2024 | 2017-2024 |
| Total invested in low-carbon projectsii | $ billion | 4.0 | 5.0 | 4.0 | 5.2 | 5.6 | 9.7 (11) | 21.5 (11) | 24.3 | 13% | 508% |
| Total invested in low-carbon acquisitions | $ billion | 0.3 (5) | 0.9 (5) | 1.1 (9) | 1.6 (9) | 7.7 (9) | 13.2 (10) | 7.1 (9) | 3.5 (7) | -51% | 1232% |
| R&D expenditures on low-carbon technologiesiii | $ billion | 0.7 (9) | 1.0 (9) | 1.0 (9) | 0.8 (11) | 1.3 (11) | 1.6 (11) | 2.0 (11) | 2.3 (11) | 19% | 234% |
| Low-carbon R&D as a share of total R&D investment | % | 19% (9) | 15% (9) | 15% (9) | 12% (11) | 17% (11) | 30% (11) | 35% (11) | 39% (11) | 9% | 104% |
i. 2022 and 2023 data restated.
ii. Low-carbon energy technologies include but are not limited to wind, solar and other renewable energies, carbon-efficient energy management, CCUS, blue and green hydrogen, biofuels, synfuels, energy storage and sustainable mobility.
iii. R&D spending is additional to investment.
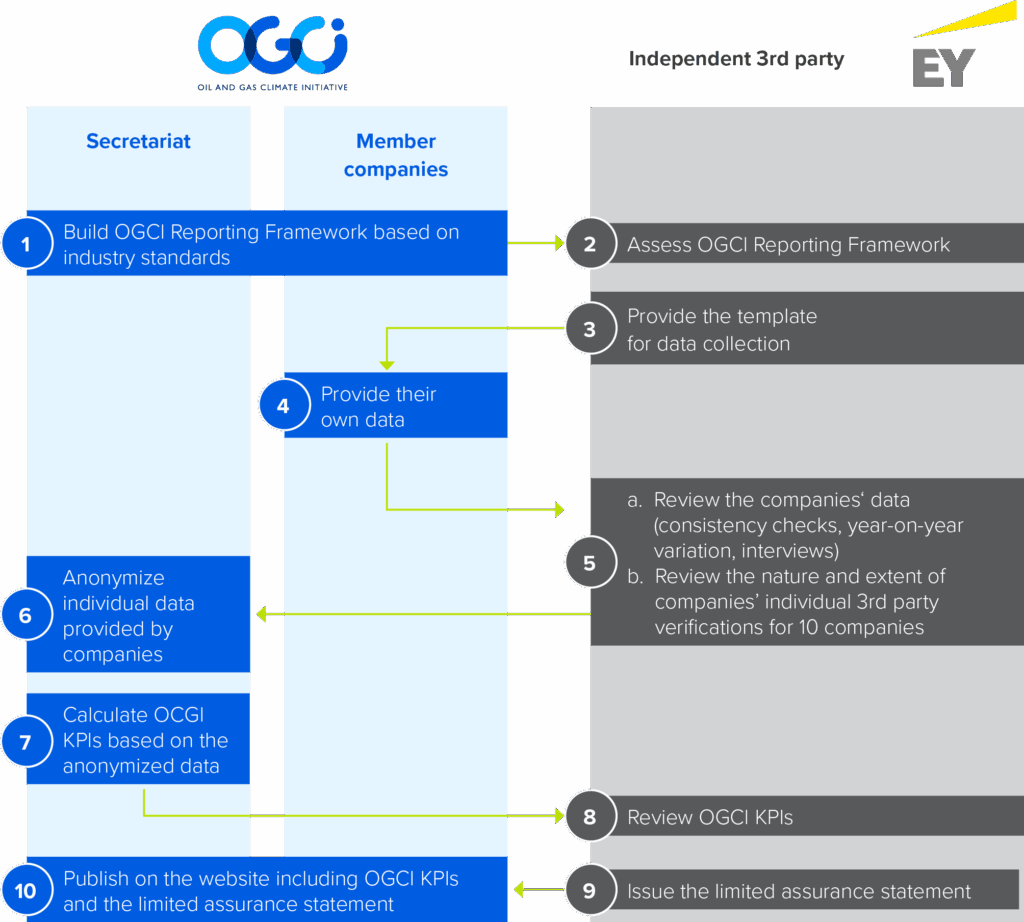
OGCI and EY data consolidation and review process
Since 2016, OGCI has been working with EY & Associés (EY), as an independent third party, to collect and check data consistency, and guarantee the confidentiality of member companies’ data.
We developed together with EY an innovative process, applicable to both listed and state-owned national oil companies, to aggregate information about the level of third-party assurance that member companies apply individually into OGCI data reporting.
Most OGCI member companies already ensure that data reported to OGCI are independently verified. This additional step confirms that OGCI data, as well as information about third-party data assurance, are consolidated, reviewed and challenged in order to increase the reliability of the aggregate data we publish.
Since 2020, we have worked with EY to develop and implement a verification process for a selection of our aggregate data.
EY’s statement this year covers nine of OGCI’s 12 members.
Our process for data consolidation and review
Independent verifier’s report on a selection of indicators for the calendar year ended December 31, 2024
We have been engaged by OGCI Climate Investments LLP, on behalf of OGCI, to perform a ‘limited assurance engagement,’ as defined by International Standards on Assurance Engagements, hereafter referred to as the engagement, to report on a selection of OGCI indicators (the “OGCI Indicators”) detailed in Appendix 1 contained in OGCI’s performance data for the year ended December 31, 2024.
Basis for Qualified Conclusion
Qualified Conclusion
Based on our work, described in the “Nature and scope of the work” section of this report, except for the possible effects of the matters described in the Basis for Qualified Conclusion section, nothing has come to our attention that causes us to believe that the OGCI Indicators are not presented, in all material respects, in accordance with version 3.8 of the OGCI Reporting Framework dated March 2025.
Emphasis of matter
We draw attention to Notes 7.2, 7.3, 9.6 and Appendix C of the OGCI Reporting Framework and to the OGCI Progress report which describe that:
- For the reporting of GHG emissions, companies can use the same methodology approach used for their public reporting of GHG emissions in other relevant documentation (e.g. Annual Report, Sustainability Report, etc.).
- Company and/or regulatory recording and reporting requirements for methane vary between and within OGCI companies and operating jurisdictions.
Our conclusion is not qualified in respect of this matter.
Understanding how OGCI has prepared the OGCI Indicators
The absence of a commonly used, generally accepted reporting framework or a significant body of established practice on which to draw, evaluate and measure sustainability information allows for different, but acceptable, measurement techniques that can affect comparability between entities and over time. Consequently, the OGCI Indicators need to be read and understood together with version 3.8 of the OGCI Reporting Framework dated March 2025, which OGCI has used to prepare the OGCI Indicators.
Responsibility of OGCI
As part of this voluntary approach, it is the responsibility of OGCI to:
- disclose version 3.8 of the OGCI Reporting Framework dated March 2025, available on OGCI’s website;
- consolidate the anonymized member companies’ data and ensure their consistency;
- publish the consolidated OGCI Indicators on OGCI’s website.
Responsibility of OGCI’s member companies
As part of this voluntary approach, it is the responsibility of OGCI’s member companies to report to OGCI their data according to version 3.8 of the OGCI Reporting Framework dated March 2025, to arrange external verification in accordance with OGCI’s and EY’s criteria, and to provide EY with a summary of the nature and details of the verification performed on their data at member-company level, together with associated findings.
Independence and quality management
We have maintained our independence and confirm that we have met the requirements of the Code of Ethics for Professional Accountants issued by the International Ethics Standards Board for Accountants, and have the required competencies and experience to conduct this assurance engagement.
EY also applies International Standard on Quality Management 1, Quality Management for Firms that Perform Audits or Reviews of Financial Statements, or Other Assurance or Related Services Engagements, which requires that we design, implement and operate a system of quality management including policies or procedures regarding compliance with ethical requirements, professional standards and applicable legal and regulatory requirements.
Responsibility of the independent verifier
Our responsibility is to express a conclusion on the presentation of the OGCI Indicators based on the evidence we have obtained.
We conducted our engagement in accordance with International Standard on Assurance Engagements 3000 Revised, Assurance Engagements Other Than Audits or Reviews of Historical Financial Information (”ISAE 3000 (Revised)”) and with professional standards applicable in France. Those standards require that we plan and perform our engagement to express a conclusion on whether we are aware of any material modifications that need to be made to the OGCI Indicators in order for them to be in accordance with version 3.8 of the OGCI Reporting Framework dated March 2025, and to issue a report. The nature, timing and extent of the procedures selected depend on our judgment, including an assessment of the risk of material misstatement, whether due to fraud or error.
We believe that the evidence obtained is sufficient and appropriate to provide a basis for our limited assurance conclusions.
It is not our responsibility to give an opinion on the entire annual report or on the compliance of the OGCI Indicators with applicable legal provisions.
Nature and scope of the work
Procedures performed in a limited assurance engagement vary in nature and timing and are less in extent than for a reasonable assurance engagement. Consequently, the level of assurance obtained in a limited assurance engagement is substantially lower than the assurance that would have been obtained had a reasonable assurance engagement been performed. Our procedures were designed to obtain a limited level of assurance on which to base our conclusion and do not provide all the evidence that would be required to provide a reasonable level of assurance.
We conducted the work described below:
- We assessed the suitability of version 3.8 of the OGCI Reporting Framework dated March 2025 in terms of its relevance, comprehensiveness, reliability, neutrality and understandability by taking into consideration the best practices of the oil and gas industry.
- We conducted the following work related to the consistency and the arithmetical accuracy of member companies’ data reported by 12 OGCI’s member companies with the OGCI Reporting Framework dated March 2025:
- assessment of the appropriate application of version 3.8 of the OGCI Reporting Framework dated March 2025 to the member-company data;
- analysis and investigation of member-company data value change in 2024 compared to 2023;
- calculation of consistency ratios and investigation to identify potential outliers among member-company data.
- We conducted a reconciliation between member-company data and publicly available information.
- We assessed the nature and extent of third-party verification conducted at company level on member-company data against the following topics (hereafter the “Criteria”) through the collection of supporting evidence and interviews with the external third parties of member companies, based on the following:
- level of assurance;
- work program;
- assurance standard;
- audit findings;
- Scope 1 operated emissions coverage reached with site-level verifications;
- physical site visits;
- remote site visits;
- total man days allocated to the verification;
- third-party team members’ competencies.
- We conducted interviews with 12 OGCI’s member companies.
- We reviewed the consolidation performed by OGCI on the anonymized member-company data.
We consider that the work we have performed by exercising our professional judgment allows us to express a limited assurance conclusion; an assurance of a higher level would have required more extensive verification work.
Paris-La Défense, October 14, 2025

EY & Associés
Partner, Sustainable Development
Christophe Schmeitzky
Percentage of OGCI Indicators considered as reviewed by an external third party and for which the third-party verification work has been shared with EY
| OGCI indicators | OGCI Indicators value in the 2024 annual report | Percentage of 2024 OGCI Indicators considered reviewedi by an external third-party </strong > | Percentage of 2024 OGCI Indicators for which the third-party verification work has been shared with EY |
| Operated greenhouse gas emissions – all sectors (Scope 1)iv | 543 MtCO2e | 100% | 75% |
| Operated greenhouse gas emissions – upstream (Scope 1)iv | 260 MtCO2e | 100% | 81% |
| Operated greenhouse gas emissions – upstream (Scope 2 Market-based)ii | 13 MtCO2e (10) | 100% | 100% |
| Operated greenhouse gas emissions – upstream (Scope 2 location-based) | 44 MtCO2e | 99% | 50% |
| Operated methane emissions – all sectorsiii | |||
| 0.8 MtCO2e | 100% | 58% |
| 31% | 31% | |
| Operated methane emissions – upstreamiii | |||
| 0.7 MtCO2e | 100% | 58% |
| 31% | 31% | |
| Natural gas flared – upstreamiv | 10,748 MMSm3 | 100% | 92% |
| Flaring greenhouse gas emissions – upstreamiv | 28 MtCO2e | 100% | 93% |
Notes:
i. An indicator is considered as “reviewed” if it was published in a publicly available document and if it was covered by an opinion or conclusion statement provided by an external third party or was reported to a governmental authority and available to public. None of the opinion/conclusion statements consulted contained any qualification. Only limited and reasonable assurance levels of opinion have been considered.
ii. All indicators are operated. “Operated greenhouse gas emissions – upstream (Scope 1)”, “Operated greenhouse gas emissions – upstream (Scope 2 Market-based)”, “Natural gas flared – upstream” and “Flaring greenhouse gas emissions – upstream” indicators are considered reviewed if the “Greenhouse gas emissions – all sectors” are reviewed, as they are part of the overall greenhouse gas emissions review.
iii. Upstream scope 2 emissions are reported exclusively using the market-based approach. As a result, the aggregated data includes only 10 out of 12 companies, since the remaining two report solely using the location-based method.
iv. “Operated methane emissions” indicator is considered reviewed if “Operated methane emissions – upstream” are reviewed, as methane emissions mainly occur in upstream activities. “Operated methane emissions” and “Operated methane emissions – upstream” are not automatically considered as reviewed if only the “Greenhouse gas emissions – all sectors” are reviewed (as methane emissions generally represent a minor fraction of total greenhouse gas emissions).
- OGCI Reporting Framework 2025.
- One member company has been unable to submit audited performance data in time for the publication of the 2024 Progress Report and 2022 data for that company has been used in place of the 2023 data. Where the company was unable to provide the full data set for 2024, the missing data has been estimated using 2022 data as a reference. This applies to the following KPIs: total operated GHG emissions Scope 1 upstream, total operated GHG emissions Scope 2 upstream, operated methane emissions upstream, natural gas flared upstream, routine gas flared upstream, flaring GHG emissions upstream and upstream flaring intensity. Data for 2023 and 2024 will be updated as needed in the next annual Progress Report, which is expected to be published in the fourth quarter of 2026.
- Per World Bank Zero Routine Flaring by 2030 initiative. www.worldbank.org/en/programs/zero-routine-flaring-by-2030.
- Provisional estimate of global oil and gas production of approximately 166 Mboe/day in 2024, based on IEA indicators for oil production of 97.2 Mboe/day and global natural gas production of 68.5 Mboe/day. OGCI member companies’ share of total oil and gas production is 25.4% on an operated basis and 21.5% on an equity basis. Source: IEA Oil Market Report (January 2025), IEA Gas Market Report Q1 2025.
- Total GHG emissions excluding LULUCF was 57 Gt CO2e in 2023, UNEP’s latest Emissions Gap Report published in 2024, p. XII
- Per World Bank Zero Routine Flaring by 2030 initiative. www.worldbank.org/en/programs/zero-routine-flaring-by-2030
- The coverage percentage for “Operated greenhouse gas emissions – all sectors (Scope 1)”, along with other OGCI indicators listed in Appendix 1, is presented based on a scope of 10 companies, in order to preserve confidentiality.
The coverage percentage for “Operated greenhouse gas emissions – all sectors (Scope 1)”, along with other OGCI indicators listed in Appendix 1, is presented based on a scope of 10 companies, in order to preserve confidentiality.